

In a time when it seems like Republicans and Democrats cannot agree on anything, there is something that appears to have bipartisan agreement: overspending. In an analysis of state government spending in all 50 states, it is clear that all state governments are growing at an unsustainable rate, some more so than others.
A reasonable baseline is for a state to adjust spending in line with inflation and population changes. Americans for Tax Reform used the Tax Foundation’s handy state spending calendar to find out how state spending over the last decade compared to inflation and population growth. The chart below shows how cumulative state spending in all 50 states has increased at a much faster rate than population growth and inflation. The orange line below shows change in population and inflation from 1999 to 2009. The blue line represents growth in total state government spending during that period.
First, here is the national trend, looking at all 50 states:
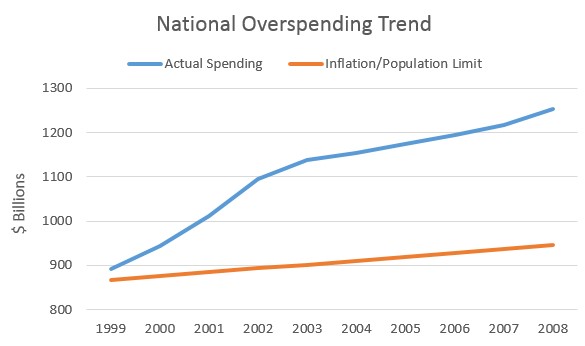
(Source: U.S. Census Bureau, Tax Foundation)
This information is more useful if we break it down state-by-state to see who the worst offenders of overspending are. Below is a table of each state and the percent that they overspent beyond the rate of growth the population and inflation over the 10 year period from 1999 to 2009:
|
State |
Overspending Percent |
|
California |
36% |
|
Wyoming |
33% |
|
Oklahoma |
31% |
|
Mississippi |
31% |
|
Kansas |
31% |
|
Wisconsin |
31% |
|
South Carolina |
27% |
|
Rhode Island |
27% |
|
Florida |
27% |
|
Maine |
26% |
|
New Mexico |
25% |
|
Indiana |
25% |
|
Colorado |
24% |
|
Nebraska |
24% |
|
Vermont |
24% |
|
Pennsylvania |
24% |
|
Kentucky |
23% |
|
Illinois |
23% |
|
Louisiana |
23% |
|
Ohio |
23% |
|
Maryland |
23% |
|
Arkansas |
23% |
|
Minnesota |
22% |
|
New Jersey |
22% |
|
Missouri |
22% |
|
Arizona |
22% |
|
Delaware |
22% |
|
North Carolina |
22% |
|
Iowa |
21% |
|
Alabama |
21% |
|
Idaho |
20% |
|
Texas |
20% |
|
Tennessee |
20% |
|
Michigan |
19% |
|
Montana |
19% |
|
New York |
18% |
|
Alaska |
18% |
|
Virginia |
16% |
|
Washington |
16% |
|
Georgia |
16% |
|
North Dakota |
16% |
|
Massachusetts |
16% |
|
South Dakota |
16% |
|
Hawaii |
15% |
|
West Virginia |
14% |
|
Oregon |
14% |
|
Connecticut |
14% |
|
Utah |
12% |
|
New Hampshire |
9% |
|
Nevada |
8% |
(Source: U.S. Census Bureau, Tax Foundation)
The biggest overspender is (unsurprisingly) California. California alone overspent by nearly $347 billion – more than the GDP of Denmark – over the decade from 1999 to 2009. But what is surprising is that each and every state overspent by billions of dollars. 33 states overspent by more than 20 percent beyond the rate of growth in population and inflation, and all but two states overspent by at least 10 percent.
State budgets have been a mixed bag this year, with some states confronting shortfalls and some who have surpluses. For state lawmakers still grappling with how to balance a budget – either through cutting spending, raising taxes, or a combination of the two – the numbers demonstrate that the problem is on the spending side of the ledger.