

Oregon’s budget increased cumulatively more than the maximum rate of population growth plus inflation in state funds and all funds from 2016-25, meaning taxes are higher than the average taxpayer can afford.
- The 2025 state funds budget is $8.2 billion higher than it would have been had spending grown at the rate of population growth plus inflation over the past decade.
- Because the state funds budget grew faster than population growth plus inflation for the last ten years, the state spent $51.2 billion too much.
- The 2025 all funds budget is $13.7 billion higher than it would have been had spending grown at the rate of population growth plus inflation over the past decade.
- Because the all funds budget grew faster than population growth plus inflation over the past decade, the state spent $89.5 billion too much.


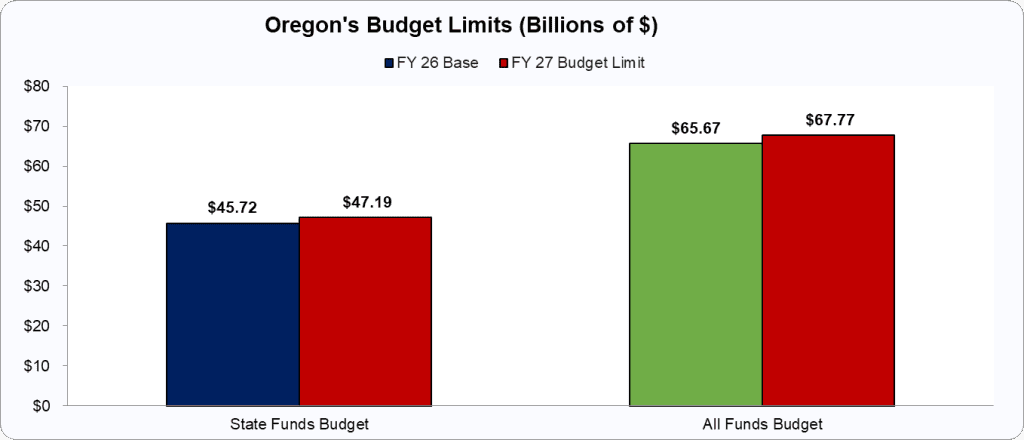
State Funds Budget Data
- Estimated FY 2026 Only State Funds Budget ($ Billions): $ 45.72
- FY 2027 Only State Funds Budget Limit ($ Billions): $ 47.19
- FY 2027 Only State Funds Budget Limit Growth (%): 3.19%
- Cost per person of only state funds budgeting more than pop+inf over the last decade in 2025 budget: $ 9,306
- Cost per family of 4 of only state funds budgeting more than pop+inf over the last decade in 2025 budget: $ 1,913
- Cumulative cost per person of only state funds budgeting more than pop+inf over the last decade from 2016-25: $ 11,979
- Cumulative cost per family of 4 of only state funds budgeting more than pop+inf over the last decade from 2016-25: $ 47,917
All Funds Budget Data
- Estimated FY 2026 All Funds Budget ($ Billions): $ 65.67
- FY 2027 All Funds Budget Limit ($ Billions): $ 67.77
- FY 2027 All Funds Budget Limit Growth (%): 3.2%
- Cost per person of all funds budgeting more than pop+inf over the last decade in 2025 budget: $ 12,868
- Cost per family of 4 of all funds budgeting more than pop+inf over the last decade in 2025 budget: $ 3,201
- Cumulative cost per person of all funds budgeting more than pop+inf over the last decade from 2016-25: $ 20,954
- Cumulative cost per family of 4 of all funds budgeting more than pop+inf over the last decade from 2016-25: $ 83,814
Other Economic and Fiscal Considerations
- Economic Freedom of North America (2023) (Rank): 46 [Fraser Institute]
- Economic Freedom (2022) (Rank): 47 [Cato Institute]
- Fiscal Policy (2022) (Rank): 44 [Cato Institute]
- Regulatory Policy (2022) (Rank): 46 [Cato Institute]
- State Tax Collections Per Capita (FY2021) ($): $4,192 [Tax Foundation]
- State Tax Collections Per Capita (FY2021) (Rank): 13 [Tax Foundation]
- State-Local Total Tax Burden per Capita (2022) ($): $6,572 [Tax Foundation]
- State-Local Tax Burden per Capita (2022) (%): 10.8% [Tax Foundation]
- State-Local Tax Burden per Capita (2022) (Rank): 31 [Tax Foundation]
- Top Income Tax Rate (2026) (%): 9.9% [Tax Foundation]
- Top Income Tax Rate (2026) (Rank): 46 [Tax Foundation]
- Flat/Progressive/Zero Income Tax (2026): P [Tax Foundation]
- Overall State Tax Competitiveness Index (2026) (Rank): 35 [Tax Foundation]
- Top Corporate Income Tax Rate (2026) (%): 7.6% [Tax Foundation]
- State-Local Sales Tax Rate (2026) (%): 0.0% [Tax Foundation]
- State-Local Sales Tax Rate (2026) (Rank): 4 [Tax Foundation]
- Property Taxes Paid as a Percentage of Owner-Occupied Housing Value (2023) (%): 0.8% [Tax Foundation]
- Property Taxes Paid as a Percentage of Owner-Occupied Housing Value (2026) (Rank): 28 [Tax Foundation]
- Economic Outlook (2025) (Rank): 43 [American Legislative Exchange Council]
- Economic Performance Rankings, 2013-2023 (2025) (Rank): 13 [American Legislative Exchange Council]
- Value for Tax and Expenditure Limits (0-3): 2 [American Legislative Exchange Council]
- Tax and Expenditure Limit (Rank): 3 [American Legislative Exchange Council]
- Right-to-Work Law (2025) (Y/N): N [American Legislative Exchange Council]
- State Spending per Capita (2022) ($): $ 10,525 [US Government Spending]
- State Spending per Capita (2022) (Rank): 46 [US Government Spending]
- Local Spending per Capita (2022) ($): $ 7,068 [US Government Spending]
- Local Spending per Capita (2022) (Rank): 42 [US Government Spending]
- Official Poverty Rate (2022-24) (%): 9.6 [Census Bureau]
- Official Poverty Rate (2022-24) (Rank): 26 [Census Bureau]
- Supplemental Poverty Rate (2022-24) (%): 9.4 [Census Bureau]
- Supplemental Poverty Rate (2022-24) (Rank): 17 [Census Bureau]
- Labor Force Participation Rate (Dec 2025) (%): 63.2% [Bureau of Labor Statistics]
- Labor Force Participation Rate (Dec 2025) (Rank): 23 [Bureau of Labor Statistics]
- Real Private Gross Domestic Product (2024) (Millions of $): $ 230,464 [Bureau of Economic Analysis]
- Real Private GDP (2024) (Rank): 25 [Bureau of Economic Analysis]
- Real Private GDP per Capita (2024): $ 54,032 [Bureau of Economic Analysis]
- Real Private GDP per Capita (2024) (Rank): 28 [Bureau of Economic Analysis]
- Real Private GDP Growth (2015-24) (%): 29.6% [US Bureau of Economic Analysis]
- Real Private GDP Growth (2015-24) (Rank): 16 [US Bureau of Economic Analysis]